Changelogs:
New Bluetooth visualizations and devices
Cue the drum roll! Introducing a new technology to Ekahau Site Survey – Bluetooth!
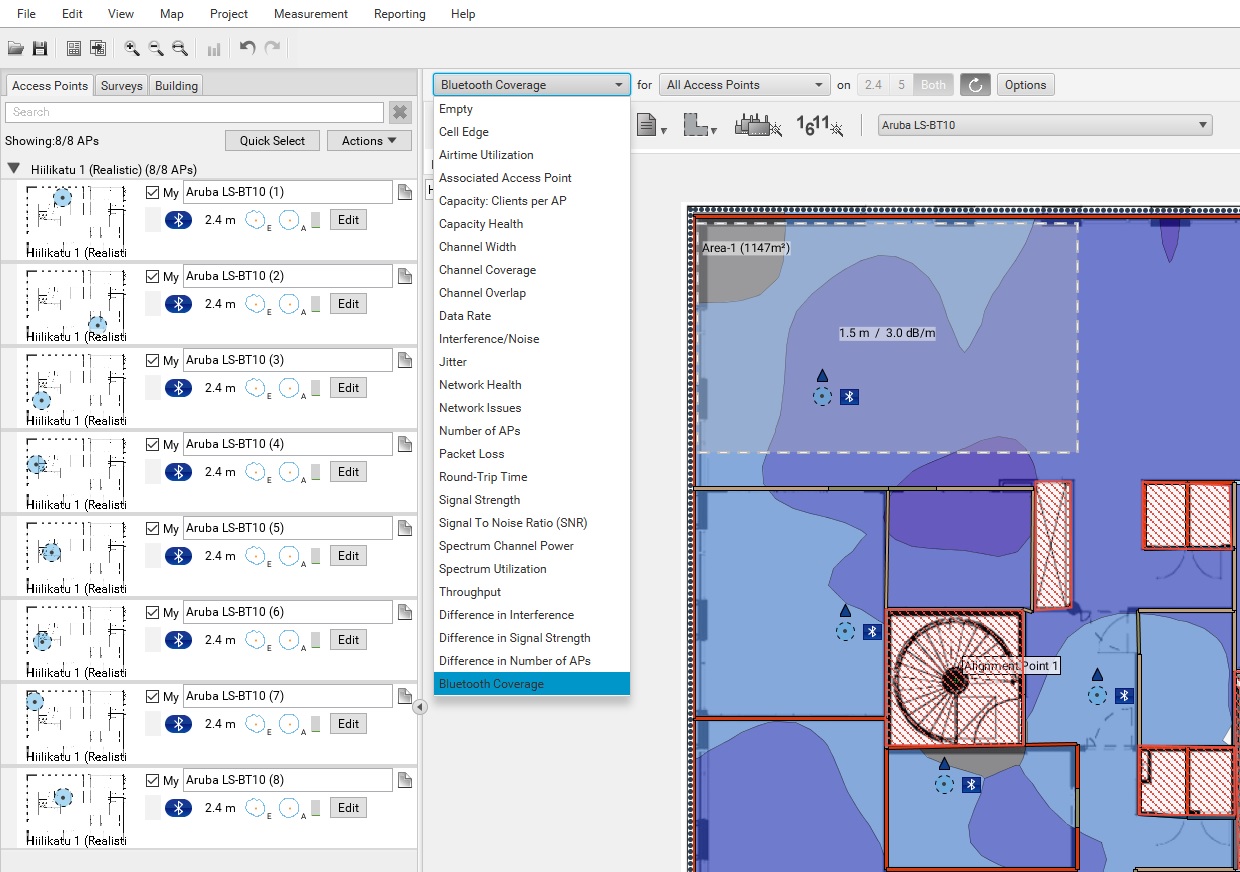
In practice this means that we have added a new visualization type to ESS called “Bluetooth Coverage”. This visualization allows you to display the coverage of your BLE devices on the map and how they overlap with each other. Overall, this visualization works fairly similarly to the familiar Number of APs visualization, which you can use as a reference point to learn the ropes with this new visualization type.
In addition to the new visualization type, we figured we’d actually need something to show in it as well. That’s why we have added a completely new device types to ESS as well! You can plan your Bluetooth coverage either with stand-alone BLE beacons or with BLE devices integrated to Wi-Fi access points.
No matter which type of BLE devices you need, you can find both of them in the access point tools.
You can find the stand-alone BLE beacons in a new sub-menu under the AP tool. Just click the new arrow sticking out from the side of the AP tool icon!
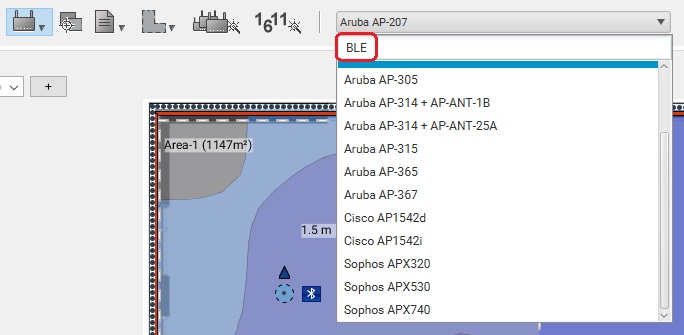
Integrated BLE devices you can find well-integrated into the regular access point selection. And how can you tell which APs also have BLE functionality? Just write “BLE” into the search list and only BLE supporting APs are filtered in!
Coverage planning – real-time coverage visualizations for simulated APs
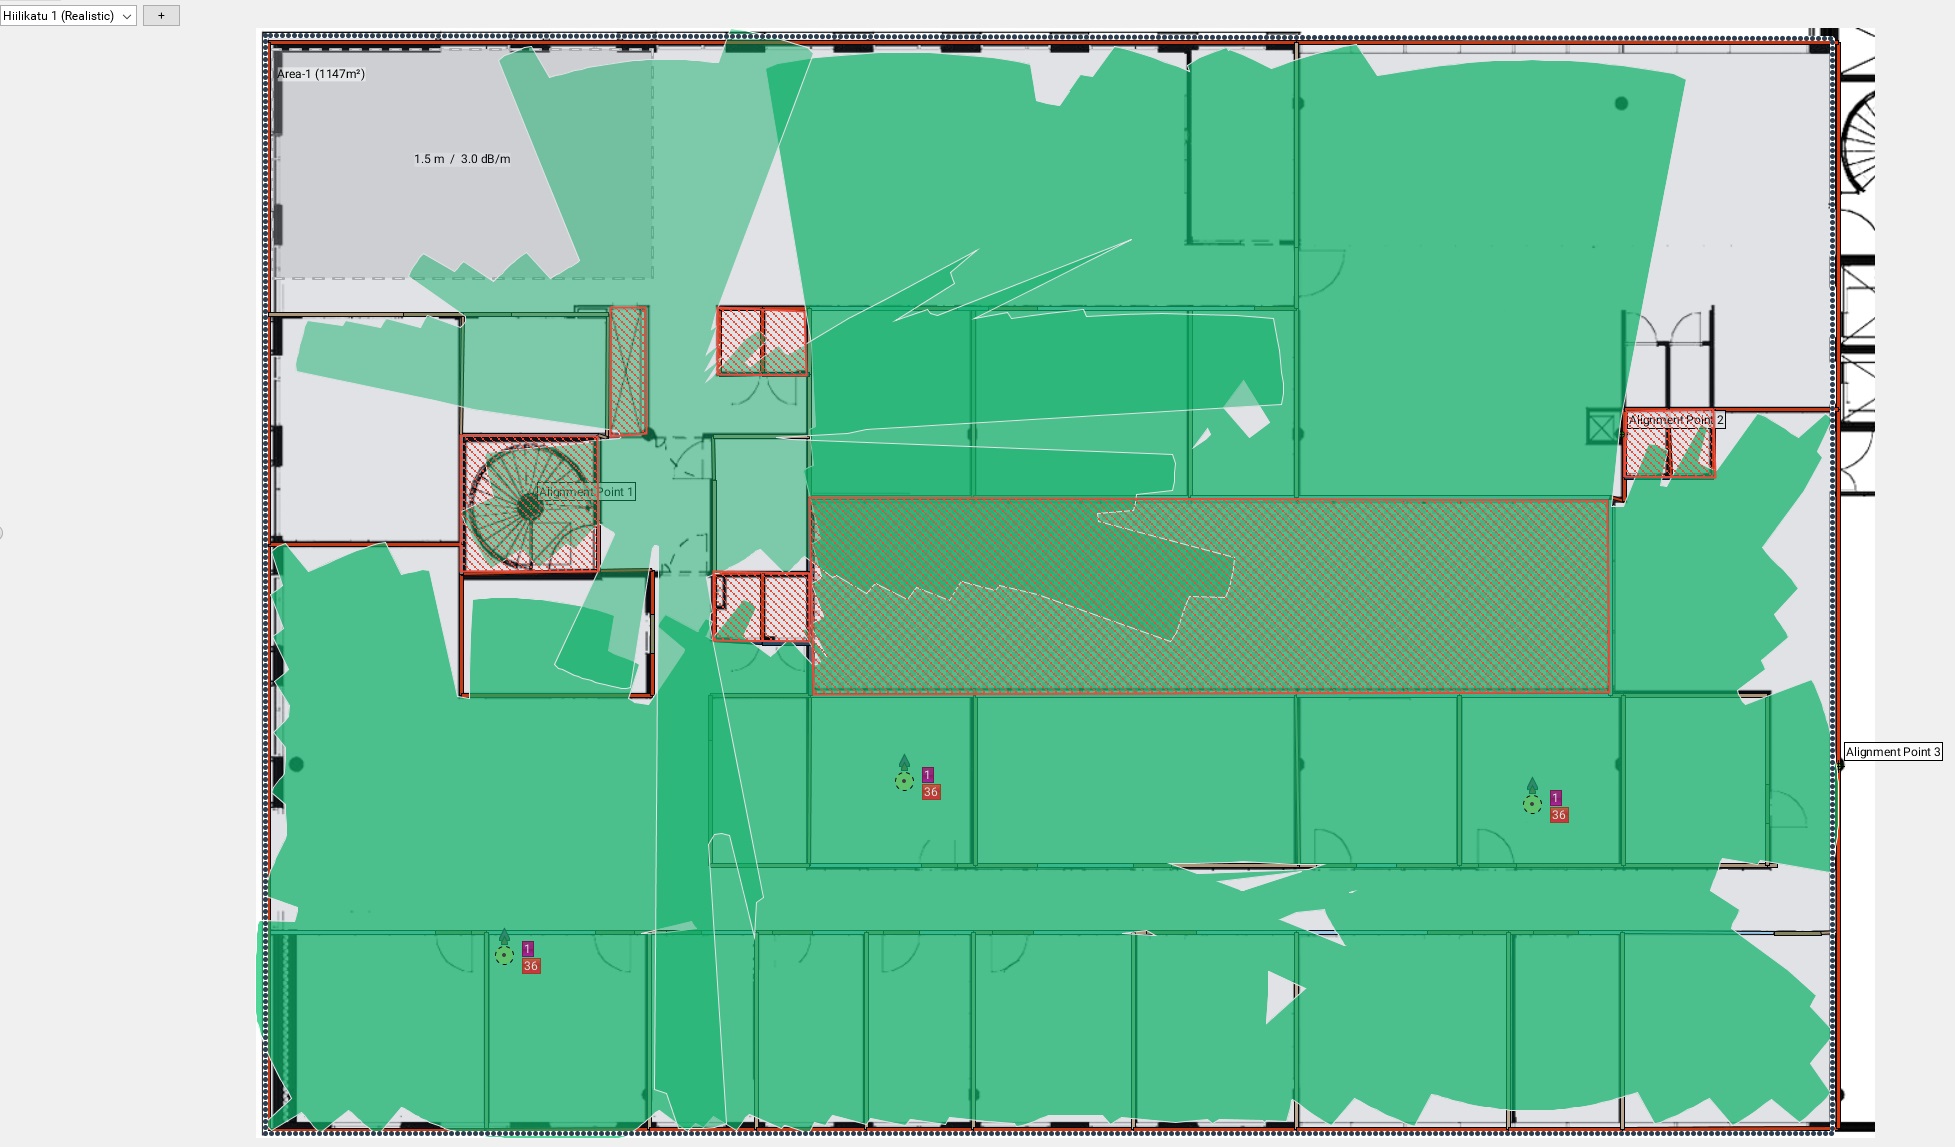
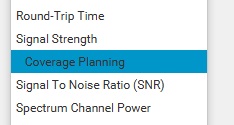
New “Coverage planning” visualization allows you to view AP’s RSSI coverage in real-time, while you’re moving the AP on the map. Paradoxically, we can’t really show the awesomeness of this feature in these still images, but we will try our best.
So, please take our word for it – like movies Coverage Planning is best when seen in motion! It will allow you to immediately see what kind of coverage a simulated AP has in any given location on the map and allows you to easily find and fine-tune optimal positions for your APs. Try it out to see for yourself!
Coverage Planning is currently its own visualization type, but it shares many similarities with Signal Strength visualization. Both visualizations display RSSI with shared grey-out values and should be used together for maximum benefit.
Other worthwhile additions in ESS 9.2.0:
- Improved DWG/SVG performance and clarity
- Aerohive AP names displayed in ESS
- APs can now be selected and moved with AP tool as well
- Further UI tweaks and fine-tuning
Download here.


